Homepage Download Four Column Chart Template

Common mistakes

  1. Leaving Columns Blank: Some people forget to fill in one or more columns. Each column is important for organizing information clearly. Ensure all sections are completed.

  2. Inconsistent Headings: Users sometimes write different headings that do not match the topic. Consistency is key. Make sure the headings relate directly to the information in each column.

  3. Adding Too Much Detail: While details are important, overloading columns with excessive information can make it confusing. Aim for clarity and conciseness.

  4. Not Reviewing for Accuracy: After filling out the form, some individuals neglect to review their entries. Always double-check for spelling and factual accuracy before submission.

  5. Ignoring the Topic: Occasionally, people stray from the specified topic, Mifflin Company in this case. Stay focused on the topic to ensure relevance and coherence in your entries.

Key takeaways

When using the Four Column Chart form, consider the following key takeaways:

  1. Clear Headings: Each column should have a clear heading that reflects the type of information you will include.
  2. Organized Information: Fill in each column with relevant details to keep your information organized and easy to understand.
  3. Focus on Topics: Ensure that the topic you choose is specific enough to allow for meaningful entries in each column.
  4. Review and Revise: After completing the chart, take time to review the information for accuracy and completeness.

Listed Questions and Answers

What is a Four Column Chart form used for?

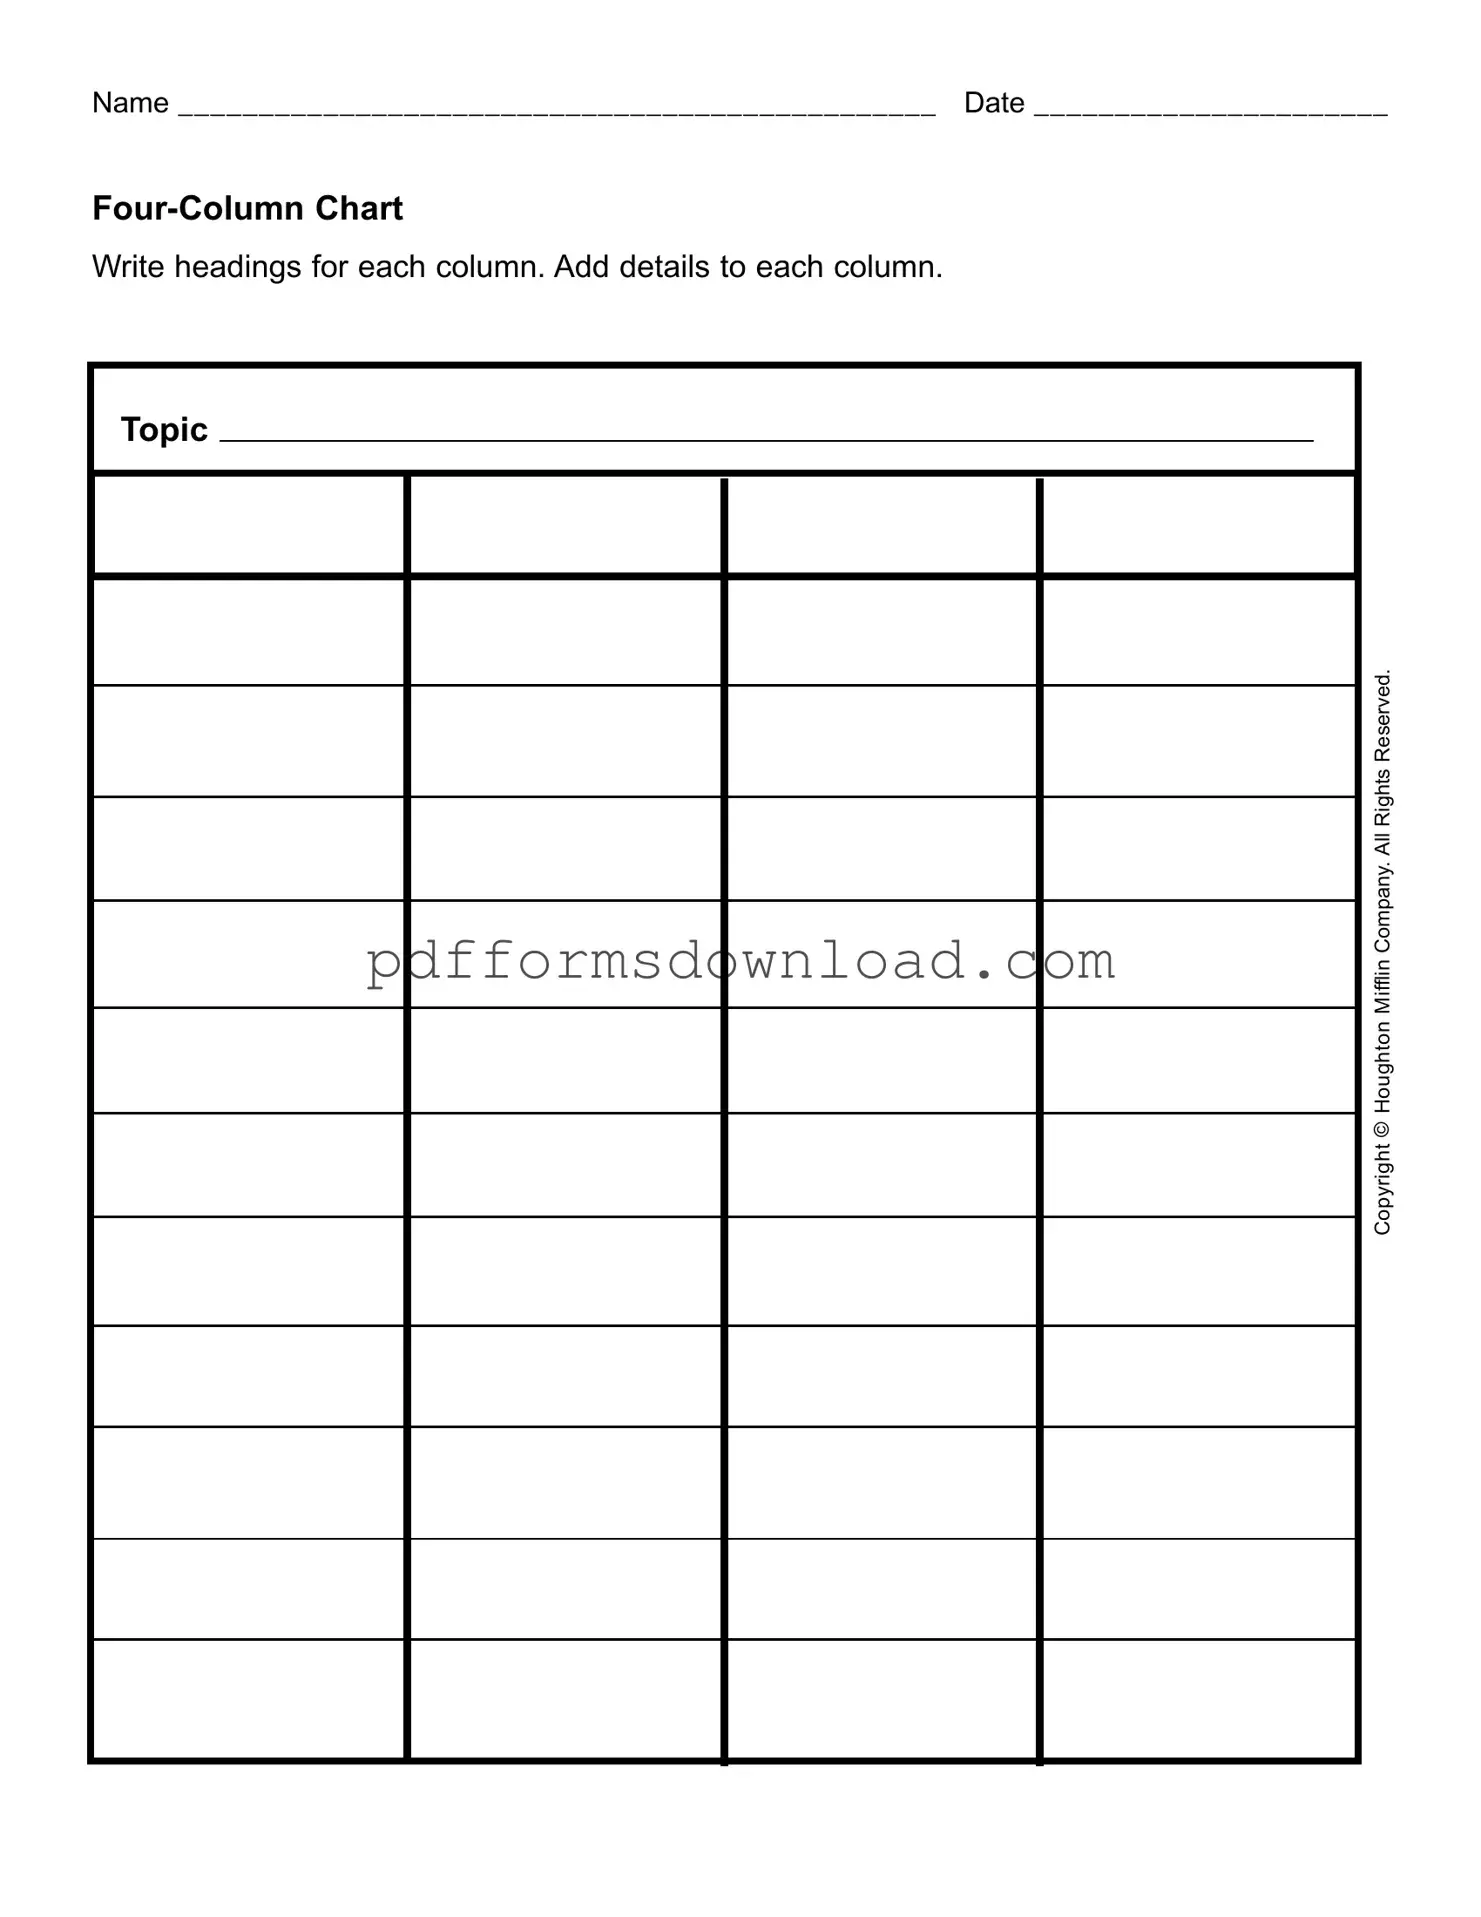
The Four Column Chart form is a versatile tool designed to help individuals organize information clearly and efficiently. It allows users to categorize data into four distinct columns, making it easier to compare and analyze different aspects of a topic. This format is particularly useful for brainstorming sessions, project planning, or any scenario where structured data presentation is beneficial.

How do I fill out the Four Column Chart form?

To fill out the Four Column Chart form, start by writing a relevant topic at the top. Next, create headings for each of the four columns based on the specific categories you want to explore. Once the headings are established, begin populating the columns with details that correspond to each heading. This process helps in organizing thoughts and ensures that all important information is captured in a systematic way.

Can I use the Four Column Chart for group projects?

Absolutely! The Four Column Chart is an excellent resource for group projects. It encourages collaboration by allowing team members to contribute their insights under each column. By working together on this chart, groups can visualize their ideas and ensure that everyone’s input is considered, leading to a more comprehensive understanding of the topic at hand.

Is there a specific way to choose headings for the columns?

Choosing headings for the columns should be guided by the nature of the topic and the information you wish to analyze. Consider what aspects are most relevant to your discussion. For instance, if the topic is a product, headings could include Features, Benefits, Challenges, and Solutions. Tailoring the headings to fit your specific needs will enhance the effectiveness of the chart.

Can I modify the Four Column Chart form for my needs?

Yes, the Four Column Chart form is flexible and can be modified to suit your specific requirements. Whether you want to change the number of columns, adjust the headings, or add additional rows, feel free to adapt the form as needed. The goal is to create a structure that best supports your analysis and communication of information.

Documents used along the form

The Four Column Chart form is a useful tool for organizing information and ideas clearly. However, several other documents can complement this form, enhancing its effectiveness in various contexts. Below is a list of commonly used forms and documents that often accompany the Four Column Chart.

  • Outline: An outline provides a structured framework for organizing thoughts and ideas before diving into detailed writing. It helps clarify the main points and supporting details.
  • Mind Map: This visual representation allows individuals to brainstorm and connect ideas in a non-linear fashion. It is particularly useful for exploring relationships between concepts.
  • Meeting Minutes: These are records of discussions and decisions made during meetings. They ensure that all participants are aware of what was discussed and agreed upon.
  • Project Plan: A project plan outlines the objectives, timelines, and resources needed for a project. It serves as a roadmap for successful project execution.
  • Residential Lease Agreement: This legal document outlines the relationship between a landlord and tenant, detailing essential terms and conditions for renting a property. For more information, visit azformsonline.com/residential-lease-agreement/.
  • Action Items List: This document tracks tasks assigned during meetings or discussions. It helps ensure accountability and follow-up on important tasks.
  • SWOT Analysis: A SWOT analysis evaluates the strengths, weaknesses, opportunities, and threats related to a project or business. It aids in strategic planning and decision-making.
  • Research Summary: This document condenses findings from research into key points. It allows for quick reference and understanding of complex information.
  • Feedback Form: A feedback form collects input from participants regarding a project or presentation. It is essential for continuous improvement and understanding audience perspectives.
  • Presentation Slides: Slides are visual aids used during presentations. They help convey information clearly and keep the audience engaged.

Each of these documents serves a distinct purpose, contributing to a comprehensive approach to information management and decision-making. Utilizing them alongside the Four Column Chart can lead to more organized and effective outcomes in various projects and discussions.